Research Summary. In the United States, Black Friday is one of the biggest days for shopping. Coming right after Thanksgiving, Black Friday starts the holiday shopping season by providing some of the best in-store and online shopping deals for consumers.
Every retail business should have a Black Friday event. Especially when you consider the following statistics:
-
Global businesses made an estimated $65.3 billion during the 2022 Black Friday sales.
-
Nearly 13% of all retail sales in the United States occur between Black Friday and Christmas.
-
There were 196.7 million shoppers in the United States on Black Friday in 2022.
-
Shoppers spent $9.12 billion online during Black Friday in 2022.
-
47% of Black Friday sales happened through mobile phones in 2022.
-
Americans save an average of 24% on Black Friday.
-
Free and fast delivery and customer reviews are more important to Black Friday shoppers than prices.
For further analysis, we broke down the data in the following ways:
Trends and Projections | Sales | Shoppers | Online Sales and Cyber Monday
Black Friday Trends and Projections
-
There was a -52% reduction in in-store shoppers between 2019 and 2020 on Black Friday.
Without a doubt, this was due to the Covid Pandemic. Consumer fears, as well as health regulations, resulted in more sales being conducted online.
-
There was a 10% increase in in-store shoppers between 2021 and 2022 on Black Friday.
Although not as vast as the 47.5% increase between 2021 and 2022, the number of people who choose to shop in store is still increasing.
-
Between 2019 and 2020, Black Friday sales increased by 32%.
Covid did not interfere with people’s spending habits. If anything, it is possible that the stresses of the Covid Pandemic, combined with more people living at home, resulted in more spending.
-
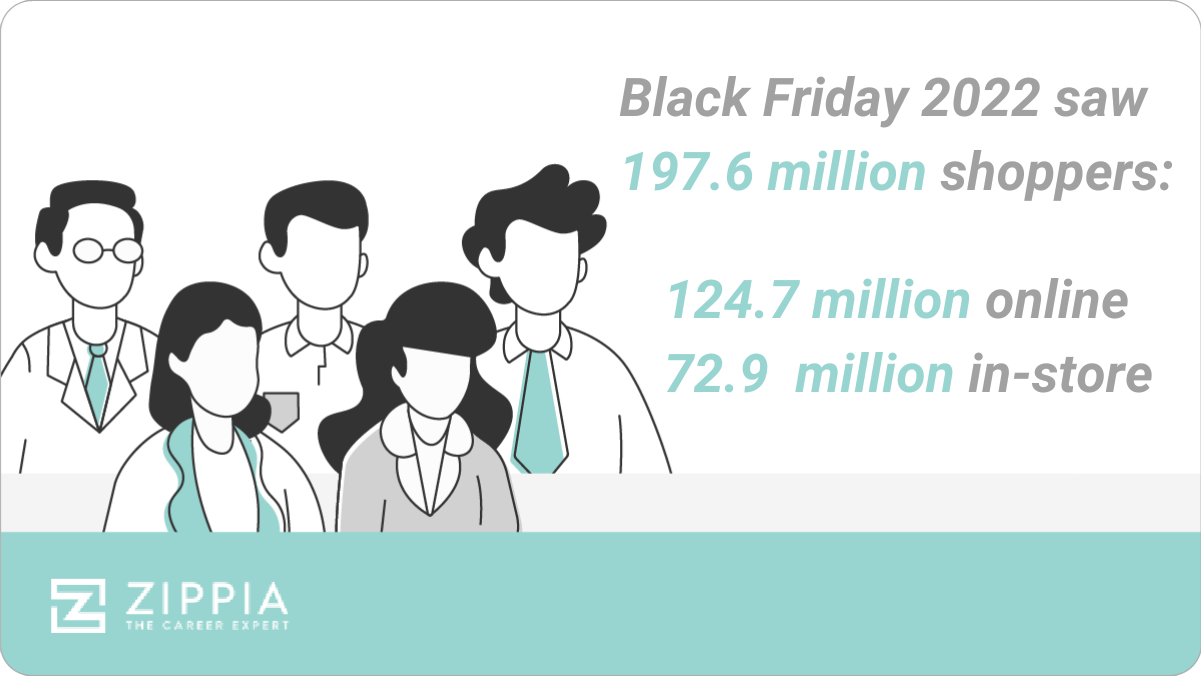
Over 42 million more people, or about a 27% increase, went shopping on Black Friday in 2022.
In 2021, an estimated 155 million people shopped during Black Friday, while in 2022, that number rose to 197.6 million. This is likely due to loosened restrictions after the end of the COVID-19 Pandemic.
Black Friday Statistics by Sales
-
188.2 billion was done in sales during the entire 2020 Black Friday weekend.
As some sales last the duration of the weekend, it is important to note that much of the Black Friday revenue is gathered in multiple days, as this statistic shows.
-
From 2017 to 2020, Black Friday weekend sales have steadily increased, with significant jumps each year.
As the table below shows, tens of billions of dollars of increased sales have occurred each year.
Year Total Sales (billions) 2020 $188.2 2019 $142.4 2018 $90.14 2017 $59.57
Black Friday Statistics by Discounts
-
The average Black Friday discount is around 25%.
Although there can be sales up to 80% off, most prices hover around the 25% mark, which allows retailers to actually turn more of a profit than when prices are kept normal due to the high volume of consumer spending.
-
Black Friday shoppers believe jewelry is the most discounted in-store item sold on Black Friday, with 49% saying so.
Electronics are a close second, with 48% of shoppers saying those products have the best in-store deals. On the other hand, only 23% of shoppers believe clothing has the best in-store deals, which is lower than any other major item.
-
Black Friday shoppers believe clothing and shoes are the most discounted online items sold on Black Friday, with 77% saying so.
Many more shoppers believe online has the best sales, with 71% of people also saying video games have the best discounts. Jewelry was the least likely to be picked for the best online discounts, and yet 51% of people still said it was the best.
| Item Type | Has The Best Discount In-Store | Has The Best Discount Online |
|---|---|---|
| Clothing and shoes | 23% | 77% |
| Electronics | 48% | 52% |
| Jewelry | 49% | 51% |
| Video games | 28% | 71% |
| Home and kitchen | 46% | 53% |
| Beauty and personal care | 38% | 61% |
| Books and music | 40% | 59% |
Black Friday Statistics by Shoppers
-
62% of buyers think Black Friday is a scam.
Further, 81% also agree that there is too much consumerism associated with Black Friday, likely contributing to the amount who believe it to be a scam. However, this doesn’t stop shoppers from participating in the event, as 80% of people are planning to shop in 2022. Talk about cognitive dissonance.
-
88% of shoppers compare discounts before buying a product on Black Friday.
Because so many shoppers believe Black Friday is a scam, and there are so many shops and websites available, it’s unsurprising to see nearly 9 in 10 of them comparing prices. For example, a shopper might look at the same product on Amazon, Walmart, and Wayfair to determine which site has the best Black Friday deal.
-
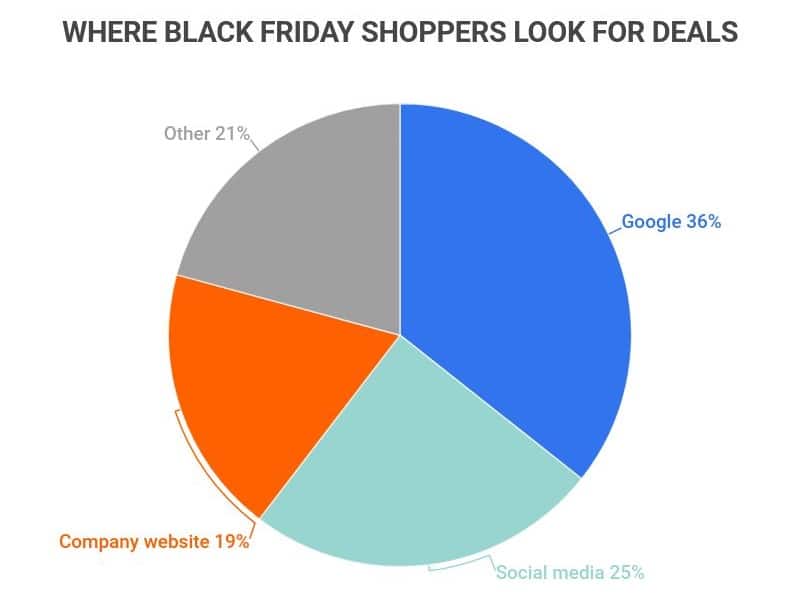
36% of Black Friday shoppers will look for deals on Google.
This is then followed by 25% who will look for deals on social media, and 19% who will look directly on the company’s website.
-
122.7 million Americans shopped on Black Friday in 2022.
This statistic includes both in-person and online shoppers. Considering that as of the 2020 U.S. Census, there are 258.3 million adults in the country, this goes to show the extent of Black Friday’s popularity.
-
The average shopper spends $430 on Black Friday.
Not only do many people shop on Black Friday, but they shop big. Consumers cannot help but take advantage of all the discounts, which increase their overall spending.
-
58% of shoppers look out for Black Friday sales.
Not surprisingly, more than half of Americans lookup for deals during Black Friday. This serves to increase demand.
-
Slightly more men plan to shop on Black Friday than women.
It is estimated that 77% of men plan to shop on Black Friday, while only 71% of women plan to do so. However, what is clear is that nearly three-quarters of both genders are actively shopping.
-
Adults between the ages of 35 and 44 make up the largest portion of shoppers on Black Friday.
As the table below shows, 33.6% of people aged between 35 to 44 shop on Black Friday, followed closely by young adults between the ages of 18 and 24.
Age Range Percent 18-24 32.6% 25-34 24.2% 35-44 33.6% 45-54 29.2% 55-64 24.6% 65+ 24.4% -
42% of shoppers say they regret buying at least one item during Black Friday.
With all the discounts, sometimes it’s hard to say no, and many shoppers acknowledge later that some of their purchases were mistakes.
Black Friday Statistics by Online Sales and Cyber Monday
-
58% of shoppers intend to shop online on Black Friday in 2023.
This is down from 64% in 2021. Even more interestingly, in 2021 only 4% of buyers abstained from Black Friday, whereas 14% did not participate in 2022.
-
87.2 million Americans shopped online on Black Friday in 2022.
Making up a large share of all total shoppers, this statistic shows that online retail is a dominant force even when Black Friday is in-store retail’s biggest day.
-
Online shopping accounted for $9 billion in sales on Black Friday in 2020, yet still only made up about a third of total sales.
This is likely due to many large purchases made in-store on high-priced items. Also, to be considered, many customers wait until Cyber Monday, the Black Friday of online retail, to make their purchases.
-
About 33% of shoppers say they plan to shop online exclusively.
What this number shows is that there is an overlap between those who both shop online and in-store.
Black Friday Statistics FAQ
-
How many people shop on Black Friday?
122.7 million Americans shopped on Black Friday in 2022. This is quite notable because the adult population of the United States stands at around 258 million people. This means that about 50% of the adult population took part in Black Friday.
With such large numbers, it is no wonder that Black Friday is one of the most important days of the year for retailers. It should come as no surprise either that Black Friday is the busiest day, by volume of sales and foot traffic, for brick and mortar retail stores.
-
How much do shoppers spend on Black Friday?
Shoppers spend on average $430 during Black Friday. This is important to note because it shows that once shoppers are enticed by the discounts, they try to maximize what they can buy.
In the end, they end up spending more money, which is exactly the retailer’s plan. Shoppers spend so much on Black Friday that some retailers even see a bigger profit than they would have if they sold their goods at normal prices.
-
What is the average Black Friday discount?
The average Black Friday discount is around 25%. However, they can sometimes be up to 70% or 80%. Retailers use these discounts to attract consumers, who in turn begin to maximize the deals they see by spending more.
This feedback loop allows retailers to make huge profits as long as their revenue exceeds the cost of the discounts. This is why the average discount hovers around 25%. It is a reasonable cut in price that still covers costs while being an attractive offer to customers.
-
Who shops the most on Black Friday?
Adults between the ages of 35 to 44 shop the most on Black Friday. Young adults ages 18 to 24 come in second, while adults ages 45 to 54 come in third. Meanwhile, 45% of online shoppers during Black Friday were millennials. What these stats show is that relatively younger populations are more likely to go after Black Friday sales.
The 35 to 44 age range, in particular, shows a group who may need the sales most. This population should have a relatively high disposable income while also being young enough in their lives that they need to buy new goods.
Conclusion
The statistics make it clear that Black Friday is a big day for retail. Rarely do retailers have the chance to bring in so much traffic in such a short spurt of time. This even allows for brick-and-mortar stores to compete effectively with online shopping sites.
With Christmas around the corner, consumers are ready to spend, both for others and for themselves. By providing once-in-a-year deals, these retailers make the most of high consumer demand. In the process, their sales convince customers to buy even more.
Black Friday is the perfect example of how a business can make money by selling items at a low cost. When discounts are appropriately placed, the business actually sees more growth.
References
-
Tidio. “Black Friday Facts & Cyber Monday Stats [Report 2022].” Accessed November 4, 2022.
-
Adobe Experience Cloud. “2021 Holiday Shopping Trends & Insights.” Accessed May 11, 2022.
-
Statista. “Holiday retail sales in the United States from 2002 to 2021.” Accessed May 11, 2022.
-
Statista. “Total retail sales in the United States from 1992 to 2021.” Accessed May 11, 2022.
-
New York Times. “Holiday Sales Soared, with e-Commerce Notching Huge Gains, a Report Says.” Accessed May 11, 2022.
-
CNBC. “Black Friday Shopping in Stores Drops 28% from Pre-Pandemic Levels as Shoppers Spread Spending Throughout the Season.” Access May 11, 2022.
-
CNBC. “Black Friday Shopping in Stores Craters 52% During Pandemic as e-Commerce Sales Surge.” Accessed May 11, 2022.
-
Finances Online. “78 Black Friday Statistics You Must Read: 2021/2022 Market Share & Data Analysis.” Accessed May 11, 2022.
-
The Ascent. “42% of Consumers Have Regretted Black Friday Purchases. How to Avoid Doing the Same This Year.” Accessed May 11, 2022.
-
Statista. “Share of total offline and online expenditure among Generation Z and millennial consumers in the United States during Black Friday in 2021.” Accessed May 11, 2022.
Author
Conor McMahon is a writer for Zippia, with previous experience in the nonprofit, customer service and technical support industries. He has a degree in Music Industry from Northeastern University and in his free time he plays guitar with his friends. Conor enjoys creative writing between his work doing professional content creation and technical documentation.